"How to decide whether a single subject score is significantly different from a group"
Posted on mars 31, 2022 in misc
Let us suppose we want to compare a single patient to a group of healthy subjects from the general population using a hypothesis testing approach.
The classical Hypothesis Testing approach
To decide whether a given man named, say, Alex, is French, one can place his height (190cm) on the distribution of heights in the whole population of french males. In other words, one determines the percentile in which this individual's score (height) falls.
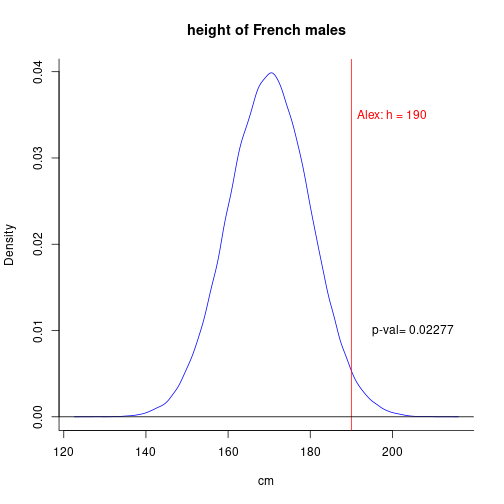
As p-val = 0.023 < 0.05 (\(\alpha\)), we can reject the null hypothesis that Alex is French!
Remarks:
-
If you find this reasoning bizarre, or absurd, complain to frequentist statisticians! (A more logically sound approach is to compare the probability of hypotheses (e.g. probs of being French, German, Italian, Martian, ...), but this concept is alien in frequentist stats)
-
You will only misclassify individuals as non-French with a probabilty of \(\alpha\), your a priori threshold, which is all the procedure is meant to do (protecting you from False Alarms when declaring an effect “significant”).
Z-scores
In practice, we hardly ever have access to data from the full population.
Given estimates of mean and stdev obtained from a large sample, we can substitute this unknown distribution by a Normal one with these parameters.
Then, we compute the patient's Z-score:
z_score = (patient - mean(big_sample)) / sd(big_sample)
## [1] "Z = 1.997"
Important: Note that we divide by the standard deviation, not the standard error!
We can then compute the prob of such an “extreme” event under \(H_0\):
pval = 1 - pnorm(z_score)
## [1] "p-val = 0.0229"
T-scores
Z-scores are fine iff you can trust the mean and stdev estimates of the population's parameters obtained from big_sample.
When all you have to characterize your population is a “small” sample of individuals, the p-value computed from the Z-score (using the empirical mean and stdev) is unreliable, and therefore the False Alarm level is not well-controlled.
William Gosset solved the issue in The probable error of a mean (published under the pen name "Student")
The essential point is that an unbiased estimate of the standard deviation of a population, when you have a sample of size \(N\), is:
\(\sigma_s = \sqrt{\frac{\sum_{i=1}^{i=N} (x_i- \bar{x})^2}{ (N - 1)}}\)
Then one computes a t-score:
\(t = (patient - mean_{group}) / \sigma_s\)
and places it on a Student \(t_{N-1}\) distribution.
This can be seen as a t-Test where the individual is treated as a sample of size 1 and this is sometimes called the “Crawford and Howell test” after a 1998 paper of theirs.
Python code
Here is some code found on a page from my web site
    from numpy import mean, std
    from scipy.stats import t

    def CrawfordTest(case, controls):
        """ Compare an individual to a sample.
        Args:
           case : score of the individual
           controls : scores from a sample group
        Return:
           the one-tail probability associated to the score 'case' compared to the scores in the list 'controls'
        """

        tobs = (case - mean(controls)) / std(controls, ddof=1)
        return t.cdf(tobs, len(controls) - 1)
The case of MRI
Univariate analyses comparing a patient's map to control maps (e.g. fMRI contrasts, or VBM densities).
One can compute the t map as follows:
def tmap_OneVsMany(patient_map, control_maps, masker):

    manyContrasts = masker.fit_transform(control_maps)
    oneContrast = masker.fit_transform([patient_map])

    mean = np.mean(manyContrast, axis=0)
    std = np.std(manyContrast, axis=0)
    n = len(many)
    correctionFactor = np.sqrt(n/(n-1))

    return masker.inverse_transform((oneContrast - mean)/(std * correctionFactor))
Supplementary Materials
More stuff on classical hypothesis testing
Detect if a dice is fair or not
I throw a dice 100 times and I observe this distribution
## dice
##  1  2  3  4  5  6
## 12 15  9 12 12 40
What is the probability that a fair dice yields such a result?
##
##  Chi-squared test for given probabilities
##
## data:  table(dice)
## X-squared = 40.28, df = 5, p-value = 1.311e-07
We reject the Null Hypothesis that all faces of the dice are equiprobable.
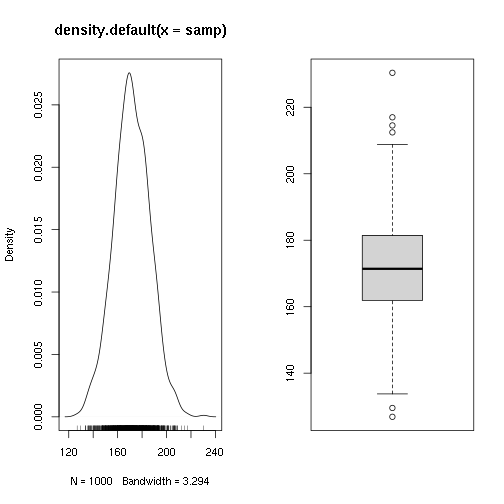
Test if a sample comes from a population of average height 1m70
##    Min. 1st Qu.  Median    Mean 3rd Qu.    Max.
##   126.9   161.9   171.4   171.6   181.4   230.4
##
##  One Sample t-test
##
## data:  samp
## t = 3.5174, df = 999, p-value = 0.0004554
## alternative hypothesis: true mean is not equal to 170
## 95 percent confidence interval:
##  170.7235 172.5496
## sample estimates:
## mean of x
##  171.6366
The formula for T is
T = (mean - 170) / sigma/sqrt(N - 1)
Let's check it:
## [1] 3.515616
Recap: the classical (frequentist) approach to Hypothesis Testing.
To check whether the mean of sample is significantly different than 0:
- Compute the p-value
p-value = (P(mean(X) > mean$_obs$ | H$_0$: the population of individuals where the orginal sample come from has a mean of exactly 0)
where: - X is a (virtual) sample of size N coming from a population of mean 0 , and sd=sd\(_obs\). - mean_obs is the "observed" average of the sample
- Compare the p-value to an a priori threshold \(\alpha\), e.g. 0.05.
Thus \(alpha\) controls for the false alarm rate over many tests.
Note: there are several ways to computer a p-value, making more or less assumptions on the population distribution.
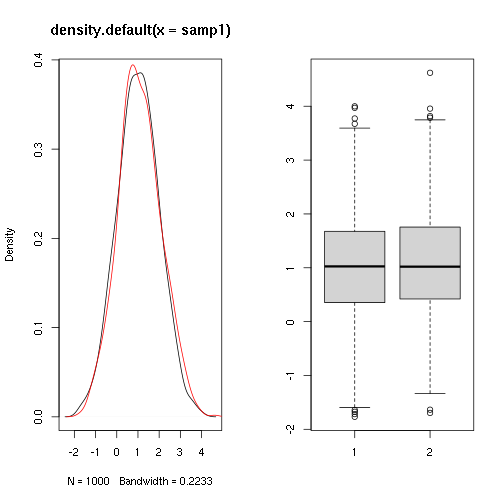
Do two samples come from populations with the same mean ?
##
##  Two Sample t-test
##
## data:  samp1 and samp2
## t = -1.6056, df = 1998, p-value = 0.1085
## alternative hypothesis: true difference in means is not equal to 0
## 95 percent confidence interval:
##  -0.15923302  0.01587286
## sample estimates:
## mean of x mean of y
##  1.016131  1.087812